A REIT in a Class of Its Own
The Essential Income REIT provides financial professionals and their investors access to institutionally managed real estate, diversified across 397 properties with long-term net leases to recession-resilient tenants.
See Essential Income REIT HighlightsCurrent Portfolio
- 1.5+ billion in asset value
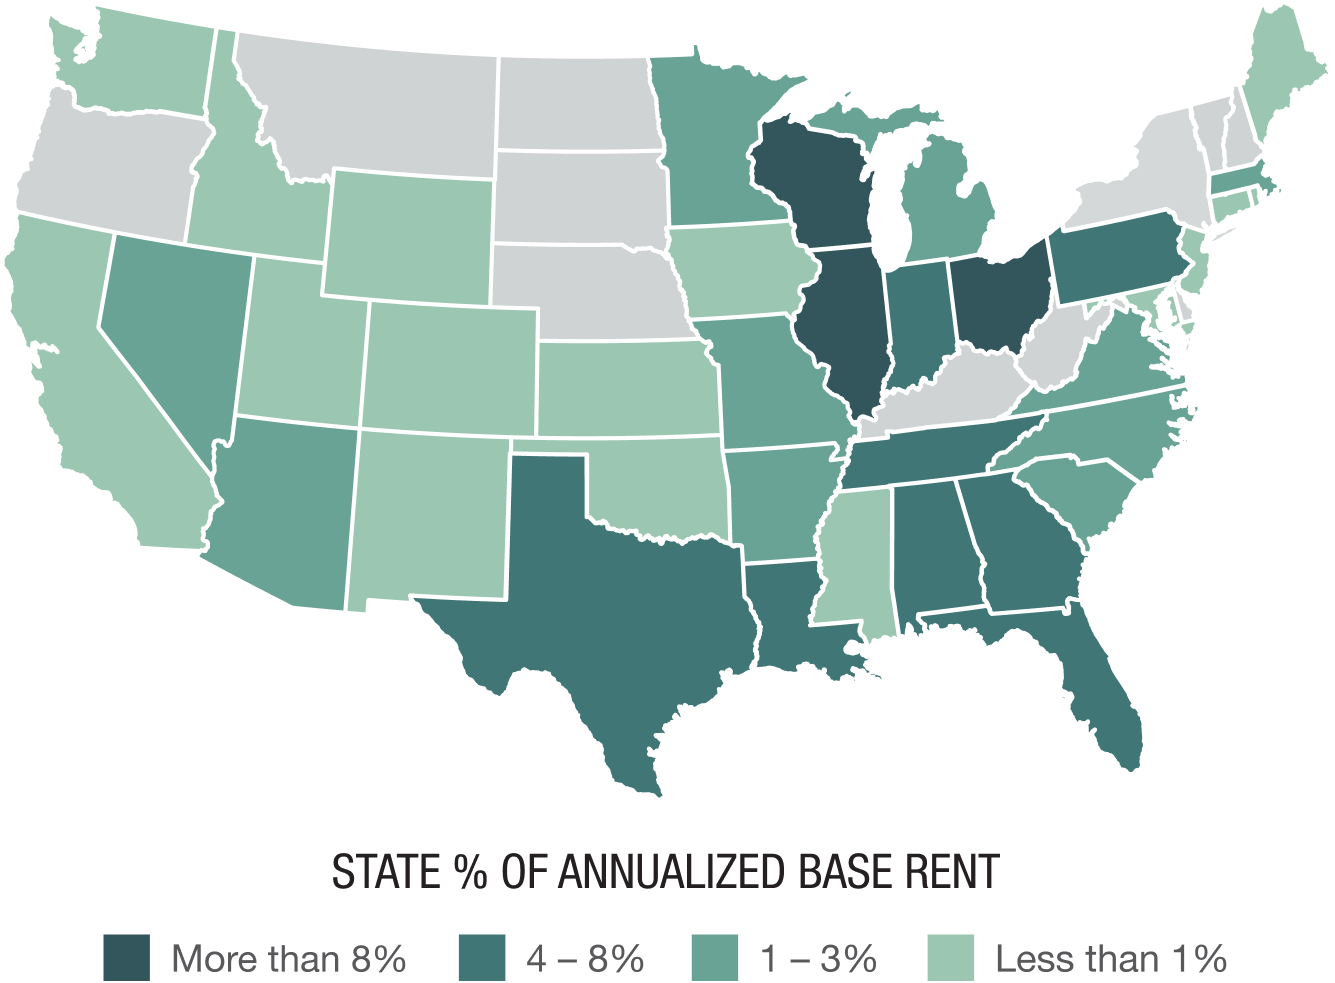
- 397 properties diversified across the U.S.
- Recession-resilient net-leased tenants with an average BBB long-term S&P credit rating1
- 9-10%+ historical tax-equivalent yield2
Review the Essential Income REIT
Click the link below if you are interested in reviewing the Essential Income REIT on behalf of your clients.
Contact Us1The average long-term S&P credit rating is presented as a simple average of the credit ratings of the REIT’s tenants with publicly rated debt.
2The tax-equivalent yield range presented above for outstanding shares (Class I, D, and A) is based on the 2025 results, current offering price, a 37% federal income tax rate, an 8% state income tax rate, and a 3.8% Medicare surcharge tax. Exact tax-equivalent yield will vary by investor.
There is no guarantee that the Essential Income REIT will be successful in executing its business plan. Investing involves risk and past performance does not guarantee future results or protect against loss. Unless otherwise noted, all stats are as of 3/31/26.
An Industry-Leading Track Record of Consistent, Tax-Efficient Distributions
Consistent Returns Despite Broad Market
Volatility Since Inception1
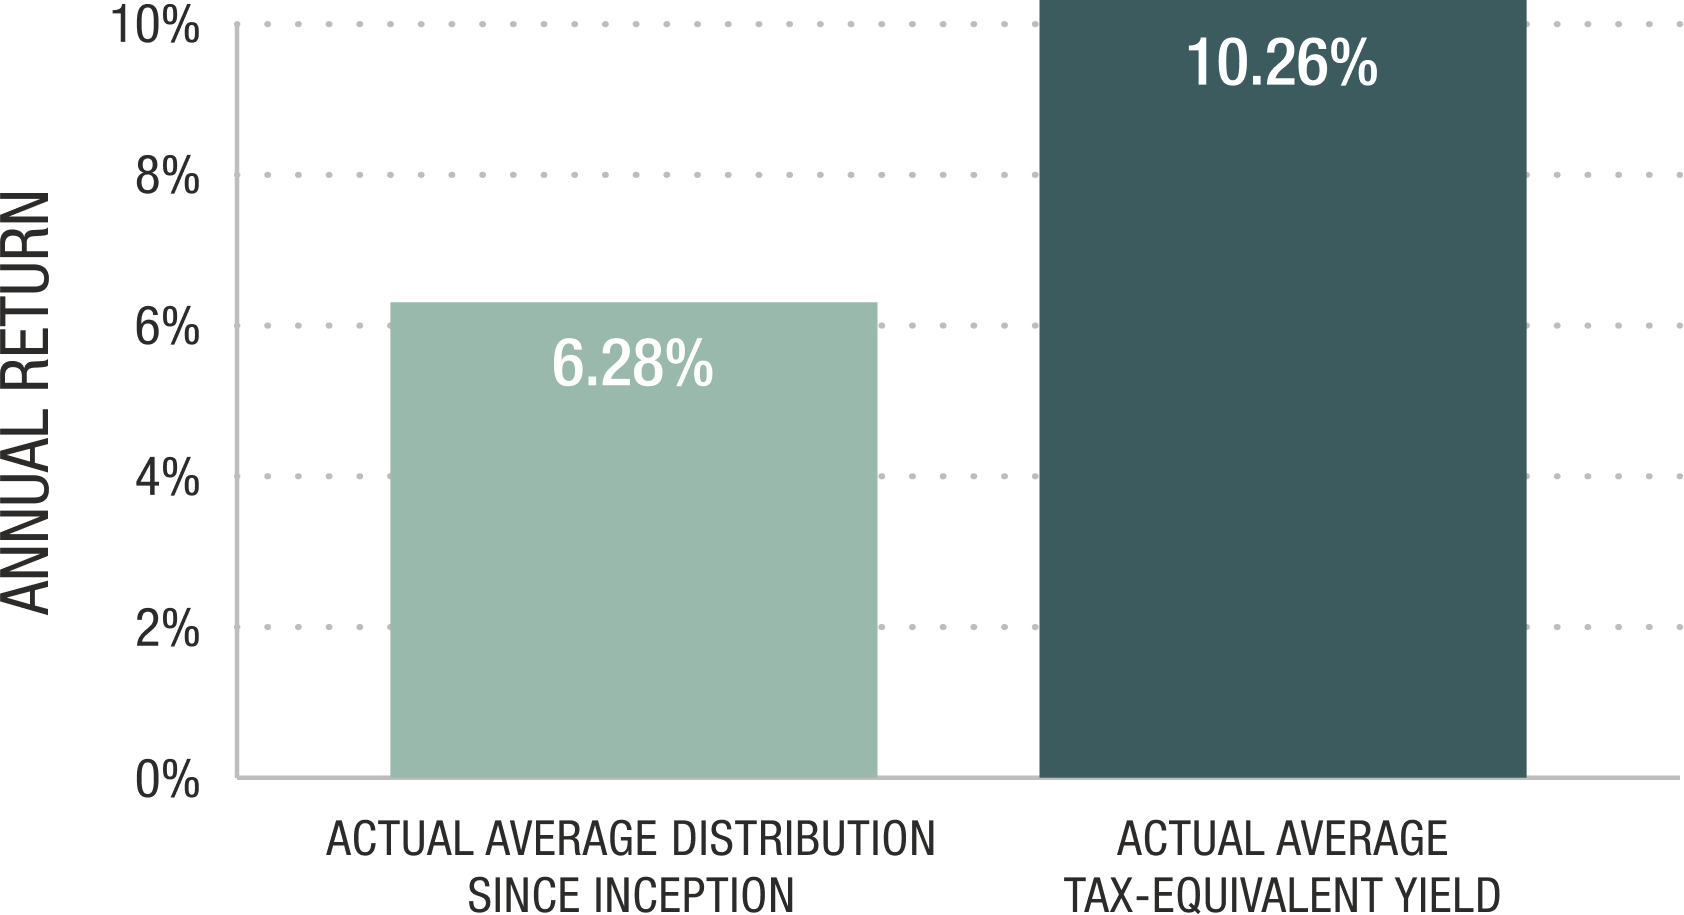
2025 Tax-Efficient
Distributions

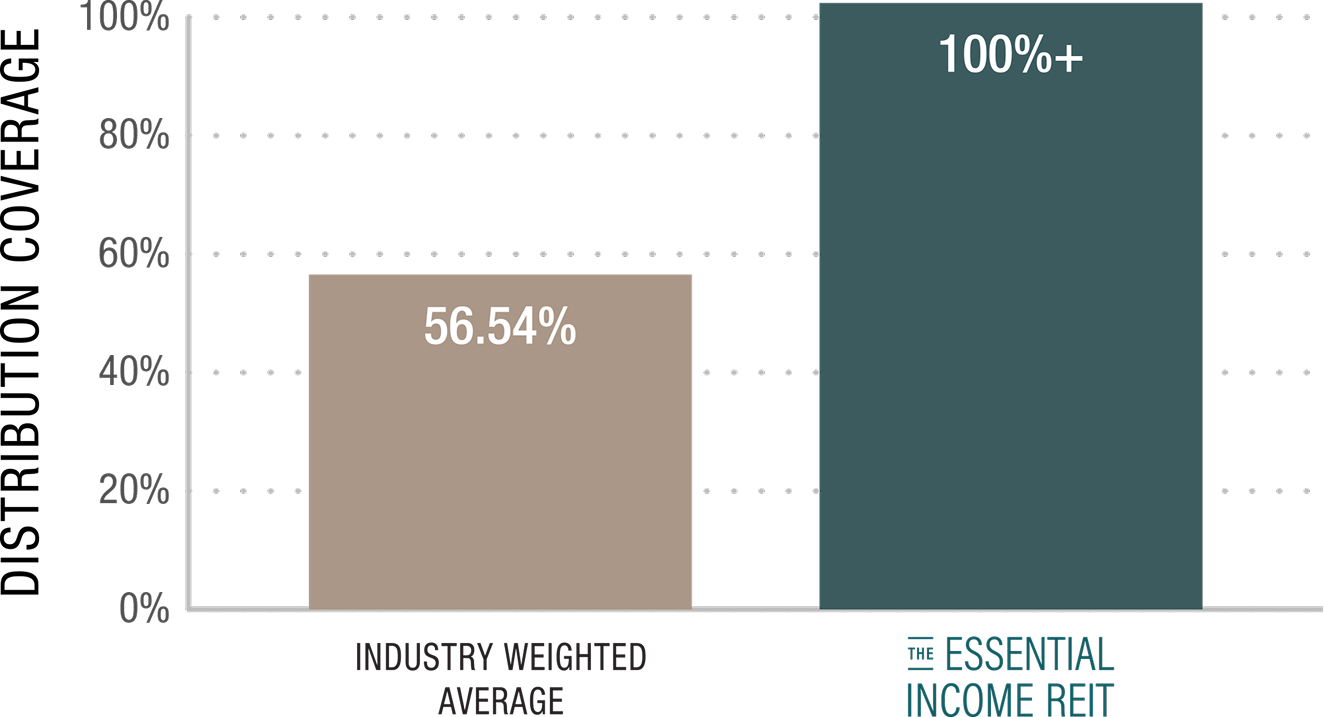
Industry & Essential Income REIT
Distribution Coverage2
Learn About the Essential Income REIT’s Tax Efficiencies
Connect with a member of our Distribution team to learn how the REIT has maintained one of the industry’s highest tax-equivalent yields.
Connect With Our Team1The tax-equivalent yield graph above provides a historical illustration of the potential tax benefits based on the current NAV/share, a 37% federal income tax rate, an 8% state income tax rate, and a 3.8% Medicare surcharge tax. Each investor should consult with their own tax advisor. Exact tax-equivalent yield will vary by investor and may be lower for certain share classes.
2Distribution coverage stats are based on Blue Vault’s 2024 Non-traded REIT Industry Review (4th ed.) pp. 51-102, which calculates adjusted funds from operations (AFFO), modified funds from operations (MFFO), or core funds from operations (FFO) divided by distributions declared for all growth or stabilizing equity non-traded REITs.
There is no guarantee that the Essential Income REIT will be successful in executing its business plan. Investing involves risk and past performance does not guarantee future results or protect against loss. Unless otherwise noted, all stats are as of 3/31/26.
Strategic Diversification to Protect Investor Capital and Income
Cash Flow and Value
Industry Allocation

Essential Businesses

Hear More About How and Why
We Diversify Our REIT
Learn more about how ExchangeRight diversifies its portfolios to protect investors from binary risk.
Access Offering MaterialsPictures are representative of similar corporate-backed stores in the ExchangeRight portfolio and are not actual properties included in the portfolio.
© 2026 ExchangeRight | Privacy Policy